
Essential Nutrition Table Chart: A Healthy And Printable Guide
Our Nutrition Assistant AI Suite will transform your body. You will lose fat, get toned, and build muscle. Gain confidence and optimal health.
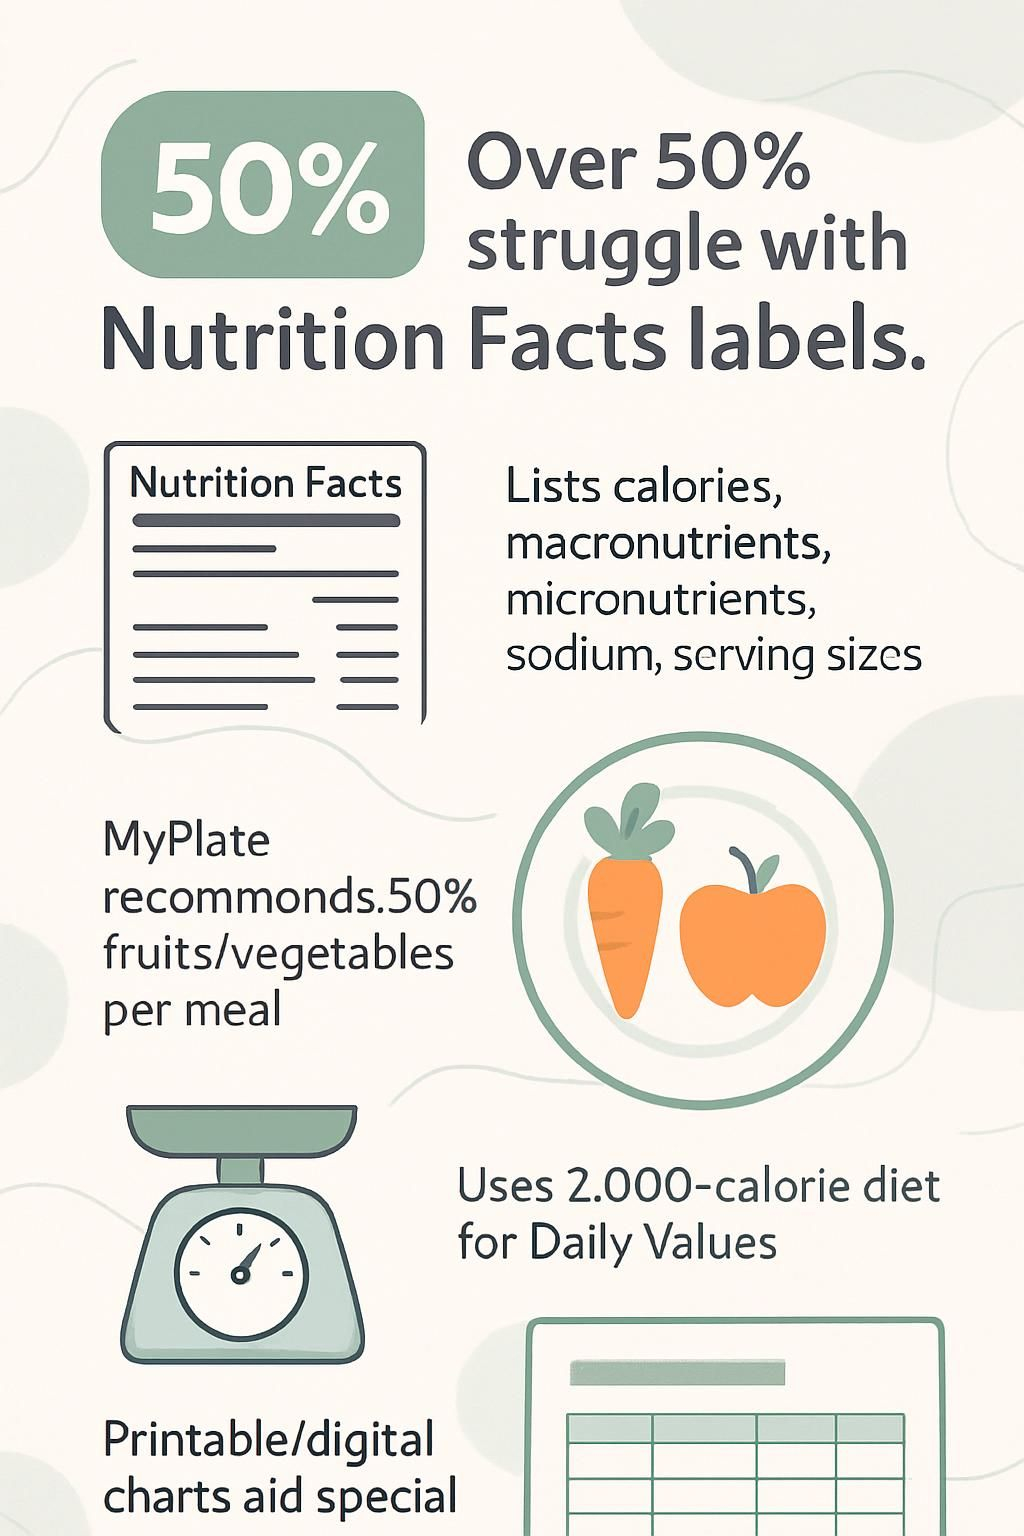
Finding clear nutrition information can be tough. Research suggests more than half of Americans struggle to read or use Nutrition Facts labels on packaged food.
A Nutrition Table Chart gives quick facts for each item you eat. You see calories, carbohydrates, protein, fat, sugar, sodium, vitamins, and minerals in one place. This guide shows how to use a chart to choose healthier food for daily meals with printable tables and simple tips.
Start reading to take control of your nutrition choices. This guide is for general education, not medical advice. For personal care, speak with a registered dietitian or your healthcare provider.
Key Takeaways
- Over half of Americans find Nutrition Facts labels hard to use. Printable nutrition table charts make daily meal planning and tracking easier.
- Charts list calories, macronutrients, micronutrients, sodium, and serving sizes. Values typically follow USDA FoodData Central 2024 data.
- MyPlate from the USDA suggests half your plate be fruits and vegetables. Studies in 2023 linked this pattern with lower added sugar and saturated fat intake. [1]
- Daily Value percentages use a 2,000 calorie reference set by the FDA. They help you compare foods and manage risks such as obesity or high blood pressure.
- Apps let you adjust servings and see instant updates. Printed charts give quick access at home for weight control or special diets like gluten free eating.
[1] U.S. Department of Agriculture (USDA). “ChooseMyPlate.gov.” Accessed January 2024.
Understanding the Nutrition Table Chart

A nutrition table chart is a simple dashboard for your plate. It summarizes the nutrients in your food so you can compare products and pick better options with confidence.
What Is a Nutrition Table Chart and What Is It Used For?
You use a nutrition table chart to see what is in your food at a glance. It lists calories, carbohydrates, protein, fat, fiber, sodium, vitamins, and minerals for a standard serving.
The Food and Drug Administration requires packaged foods in the United States to provide this information. A chart makes side by side comparisons easy, which supports choices like more fiber or less cholesterol.
If you track blood sugar or follow a healthy diet, a chart becomes your basic planning tool. You can scan categories such as fruit, vegetables, meat, and cheese to find reliable sources of key nutrients.
When I helped a school sports team plan lunches, we used USDA FoodData Central figures. Players met their carbohydrate needs without exceeding limits for trans fat set in health guidance.
Using a chart turns guesswork into evidence based decisions at every meal.
How Does It Help Promote a Healthy Diet?
A nutrition table chart offers clear facts about calories, serving sizes, and essential nutrients. You can use trusted sources like the USDA, MyPlate, and Dietary Reference Intakes to match foods to your goals.
The chart shows where to get fiber from whole grains, healthy fats from fish and vegetable oil, and key nutrients like iodine and choline. With that view, you can build balanced meals instead of relying on estimates.
If you want to cut added sugar or sodium to support heart health or weight management, the chart points you to better swaps. A printable version helps you track what types and amounts of carbs, proteins, and fats serve your needs each day.
Key Elements of a Nutrition Table Chart
A nutrition table chart summarizes the nutritional content of many foods. It is especially helpful if you follow a typical Western eating pattern or track your intake closely.
What Are the Essential Macronutrients: Carbs, Proteins, and Fats?
- Carbohydrates give your body energy, especially for the brain and muscles. Choose whole grains, fruits, and vegetables for better results than refined foods.
- Proteins build and repair tissues and support your immune system. Include lean meats, beans, eggs, or dairy to meet recommended daily intake levels.
- Fats help your body absorb vitamins A, D, E, and K. Favor unsaturated fats from nuts and fish over saturated fats common in processed food.
- Calorie counts differ. Carbs and protein provide 4 calories per gram, while fat provides 9 calories per gram. Knowing this helps manage energy intake.
- Using portion sizes from a nutrition table chart helps balance each macronutrient according to guides like MyPlate or the Healthy Eating Plate.
- Food charts and indexes help you compare carb, protein, and fat content. This supports smarter choices at the store and in your kitchen.
- For accurate guidance, rely on data from the Agricultural Research Service and the United States National Agricultural Library.
Which Vitamins and Minerals Are Vital Micronutrients?
Vitamins and minerals, also called micronutrients, support growth, immunity, and strong bones. They also reduce disease risk when you get enough from food.
- Vitamin A supports vision and immune function. Carrots, sweet potatoes, and spinach are good sources.
- B Vitamins include B6, B12, thiamine, riboflavin, niacin, folate, pantothenic acid, and biotin. They help convert food into energy and support your brain.
- Vitamin C aids wound healing and protects cells. Citrus fruits like oranges are rich in vitamin C.
- Vitamin D helps your body absorb calcium. Sunlight and fortified foods can raise your vitamin D intake.
- Vitamin E is an antioxidant that protects cell membranes from damage.
- Vitamin K is needed for normal blood clotting. Leafy greens like kale contain high amounts.
- Calcium builds bones and teeth and supports muscle function. Milk products and fortified juices are common sources.
- Iron helps red blood cells carry oxygen through your body. Lean meats and beans provide iron.
- Magnesium supports nerve signals and muscle movement. Nuts and whole grains contain magnesium.
- Potassium helps your heart rhythm and fluid balance. Bananas are one easy source.
- Fluoride strengthens tooth enamel and can help prevent cavities. Tap water and some toothpaste provide fluoride.
These nutrients fill daily gaps so you meet recommendations from MyPlate and other public health guides.
How Are Detailed Calorie Profiles Presented?
Calorie profiles use a clean layout so you can view calories, macronutrients, and micronutrients at a glance. The sample below shows typical values based on USDA FoodData Central and the Dietary Guidelines for Americans.
| Food Item | Serving Size | Calories | Carbohydrates (g) | Protein (g) | Fat (g) | Fiber (g) | Sodium (mg) | Calcium (mg) | Iron (mg) |
|---|---|---|---|---|---|---|---|---|---|
| Grilled Chicken Breast | 3 oz (85g) | 128 | 0 | 26 | 2.7 | 0 | 44 | 13 | 0.4 |
| Steamed Broccoli | 1 cup (156g) | 55 | 11 | 3.7 | 0.6 | 5.1 | 64 | 62 | 1 |
| Brown Rice, Cooked | 1 cup (195g) | 216 | 45 | 5 | 1.8 | 3.5 | 10 | 20 | 0.8 |
| Apple, Raw | 1 medium (182g) | 95 | 25 | 0.5 | 0.3 | 4.4 | 2 | 11 | 0.2 |
| Greek Yogurt, Plain | 6 oz (170g) | 100 | 6 | 17 | 0.7 | 0 | 65 | 187 | 0.1 |
- Columns show the food, serving size, calories, macronutrients, and key micronutrients.
- Serving sizes follow standardized weights from the USDA.
- Calorie values help you compare foods for meal planning.
- Macronutrient details support tracking of carbs, protein, and fat.
- Fiber, sodium, calcium, and iron help you balance daily needs.
- Charts like this make it easier to match your intake to health goals.
This layout appears in dietary guides, labels, and planning tools so you can understand and apply nutrition data quickly.
What Are the Guidelines for Serving Sizes and Portions?
Use serving sizes from trusted sources like the USDA and FDA. For example, a serving of cooked rice is half a cup, about 100 calories. A standard portion of lean meat or poultry is three ounces, roughly the size of your palm.
Most charts link nutrient values to a specific serving. That helps you compare foods fairly. A kitchen scale and measuring cups make portions more accurate at home. Smaller plates can also prevent overeating with little effort.
Portion control supports balanced intake across the day. Following these guidelines helps you meet vitamin and mineral needs without unplanned excess calories.
Advantages of Utilizing a Nutrition Table Chart
A nutrition table chart gives a clear picture of daily intake. It also sparks curiosity about healthier habits you can build over time.
How Does It Encourage Well-Balanced Eating?
The chart shows each food group side by side. That makes it easier to fill your plate with vegetables, fruits, grains, protein foods, and dairy in the right mix.
For example, MyPlate suggests half your plate be fruits and vegetables. The rest is split between grains and protein. Seeing this structure helps you spot gaps like low fiber or extra saturated fat.
With a visual target, you can meet daily goals for vitamins, minerals, and macronutrients without guessing.
How Can It Help Monitor Nutrient Intake?
A chart lets you see how much of each nutrient you get from a meal. You can compare carbohydrates, protein, fat, vitamins, and minerals against daily needs.
If a serving provides 12 percent Daily Value for calcium, you know exactly what it adds to your day. If snacks push sodium or added sugar too high, you can adjust sooner.
Reviewing these numbers after meals supports steady progress toward your goals.
In What Ways Does It Support Meal Planning and Portion Control?
A chart helps you plan balanced meals with accurate servings. You can add up calories and nutrients until you reach your target for the day.
This approach prevents overeating and reduces missed nutrients. Use serving size guides to build a shopping list that matches your plan closely.
The process saves time and supports consistent portion control at each meal.
How Does It Assist with Dietary Restrictions and Health Goals?
A chart makes it easier to meet restrictions and health goals. If you limit sodium for blood pressure, scan the sodium column to pick lower options. If you watch sugar for diabetes, review total sugars and added sugars.
Clear serving sizes also support calorie limits for weight management. The chart becomes a practical guide for carbs, fats, protein, vitamins, minerals, and calories based on MyPlate and the Healthy Eating Plate.
How to Read a Nutrition Table Chart
Learning to read a nutrition table chart helps you match meals to your goals. With a few steps, you will spot what matters most.
What Do Daily Value Percentages Mean?
Daily Value, or %DV, shows how much a nutrient in one serving contributes to your day. The FDA sets these values for adults using a 2,000 calorie reference.
If sodium reads 20 percent DV per serving, that serving gives one fifth of the recommended daily limit. You can use %DV to compare products. Lower is better for nutrients like sodium and saturated fat. Higher is better for fiber, calcium, and iron.
Understanding these numbers helps you judge whether a food is low or high in a nutrient.
How Can You Determine Accurate Serving Sizes?
Check the serving size listed on the chart or label. You will see measures like 1 cup, 28 grams, or 2 slices. Use measuring cups or a kitchen scale to match those amounts at home.
Visual cues help too. A serving of protein often fits in your palm. A half cup looks like the size of an ice cream scoop. Accurate servings make calorie and nutrient tracking more dependable.
How Do You Identify Hidden Sugars and Sodium?
Once you size your serving correctly, scan ingredient lists for hidden sugars. Words like corn syrup, fructose, maltose, and dextrose often signal added sugar in sauces, cereals, and yogurt.
Hidden sodium can appear as monosodium glutamate, sodium nitrite, or simply salt. Some foods marketed as healthy still add sodium for flavor or shelf life.
For example, one cup of instant soup can contain more than 800 milligrams of sodium. Read both the facts panel and ingredients to control intake and make better choices.
Printable Nutrition Tables for Daily Usage
Printable nutrition tables give quick access to calories and key nutrients. Keep one on your fridge so planning feels less stressful.
What Are the Different Vegetable and Fruit Chart Varieties?
Vegetable and fruit charts help you plan meals, balance nutrients, and manage serving sizes. Several formats work well at home or school.
- Color coded charts group produce by color like green, red, orange, yellow, purple, or white. Each color highlights different phytonutrients.
- Seasonal charts show which produce is in season each month. They help you shop smart at stores and farmers markets.
- Serving size charts display recommended portions for common fruits and vegetables. They align with MyPlate guidance.
- Nutrient comparison charts stack up vitamin C, fiber, potassium, or folate in popular items such as carrots, oranges, spinach, broccoli, and berries.
- Storage and shelf life charts teach how to keep produce fresh longer. For example, wrapping leafy greens in a damp towel can extend freshness for a few days.
- Calorie tables list average calories per serving and basic macros. A medium apple is about 95 calories. One cup of cooked broccoli has about 6 grams of carbs.
- Glycemic index lists rank produce by its effect on blood sugar. These can help if you track glucose for diabetes or general wellness.
- Allergen aware lists flag produce less likely to trigger reactions. Families with food sensitivities benefit from quick, clear picks.
- Kid friendly snack charts feature bite sized options like cherry tomatoes or apple slices for easy lunchbox wins.
- Global variety maps show where common produce grows. They also inspire you to try new fruits and vegetables.
Choose the chart type that fits your needs and the way you plan meals.
Which Charts Show Protein Sources?
Protein charts help you find high quality sources that fit your preferences and budget.
- Animal protein lists include chicken, beef, eggs, fish, turkey, and dairy. These usually provide all essential amino acids.
- Plant based charts feature legumes, nuts, seeds, tofu, tempeh, and beans with protein per serving.
- Visual graphs compare protein amounts using icons or colored bars. Some add portion images for quick planning.
- Interactive charts let you filter by cooking method or food group to match health goals.
- Nutrient breakdown tables include iron and vitamin B12, not just total protein.
- Printable charts speed up weekly prep. You can balance chicken breast with chickpeas in minutes.
- Special diet charts highlight lean or plant based options for high protein or low cholesterol needs.
- Many resources add %DV based on a 2,000 calorie day for fast tracking.
- Side by side charts list both calories and protein per serving for easier shopping.
- Many guides offer downloadable PDFs you can post on your fridge.
Sources:
- U.S Department of Agriculture (USDA), FoodData Central
- Harvard T.H Chan School of Public Health
How Are Calories and Nutrients Broken Down in Common Foods?
The table below shows typical calories and nutrients for everyday foods. Use it to compare items and build balanced meals.
| Food Item | Serving Size | Calories (kcal) | Carbohydrates (g) | Protein (g) | Total Fat (g) | Fiber (g) | Sugar (g) | Sodium (mg) | Key Vitamins & Minerals |
|---|---|---|---|---|---|---|---|---|---|
| Grilled Chicken Breast | 3 oz (85g) | 128 | 0 | 26 | 2.7 | 0 | 0 | 44 | Niacin, Selenium, B6 |
| Brown Rice (cooked) | 1 cup (195g) | 215 | 45 | 5 | 1.8 | 3.5 | 1 | 10 | Magnesium, Manganese |
| Broccoli (steamed) | 1 cup (156g) | 55 | 11 | 4 | 0.6 | 5.1 | 2.2 | 64 | Vitamin C, K, Folate |
| Apple (with skin) | 1 medium (182g) | 95 | 25 | 0.5 | 0.3 | 4.4 | 19 | 2 | Vitamin C, Potassium |
| Salmon (baked) | 3 oz (85g) | 177 | 0 | 17 | 11 | 0 | 0 | 50 | Omega-3, B12, D |
| Whole Wheat Bread | 1 slice (28g) | 69 | 12 | 3.6 | 1.1 | 1.9 | 1.4 | 132 | Iron, Magnesium |
| Yogurt (plain, low-fat) | 1 cup (245g) | 154 | 17 | 13 | 4 | 0 | 17 | 172 | Calcium, B12 |
| Egg (large, boiled) | 1 egg (50g) | 68 | 0.6 | 6.3 | 4.8 | 0 | 0.6 | 71 | Choline, D, B12 |
- Values are averages based on USDA data as of 2024.
- Results vary with preparation and brand.
- Serving size changes total nutrient counts.
- Use this to compare calories, carbs, fat, protein, fiber, sugars, and sodium across foods.
- Key vitamins and minerals help you target nutrient gaps.
What Are Customizable Interactive Nutrition Labels?
Interactive labels let you change serving sizes or swap ingredients and see updates instantly. Many apps allow you to build recipes, then show updated calories, protein, carbs, fats, vitamins, and minerals.
These tools support planning by matching your goals to current numbers. Some tools add color alerts for high sodium or added sugar so you stay aware as you build a meal plan.
Leading Nutrition Guidelines and Resources
Trusted guidelines can shape your eating pattern. Many provide printable charts and tables you can keep on hand.
What Is MyPlate: USDA’s Eating Guide?
MyPlate, released in 2011, is the USDA’s visual guide to a healthy plate. It splits your plate into fruits, vegetables, grains, protein foods, and dairy.
Half the plate is fruits and vegetables. The other half is grains and protein, with dairy on the side. This simple layout shows how much of each group to include at meals.
Following MyPlate helped me plan balanced dinners. I added more leafy greens and fruit alongside lean chicken and whole wheat pasta or brown rice.
Schools use MyPlate to teach healthy habits early. According to USDA data from 2023, people who follow MyPlate eat more fiber rich foods and less added sugar and saturated fat. [1]
[1] U.S. Department of Agriculture (USDA). “ChooseMyPlate.gov.” Accessed January 2024.
What Is Harvard’s Healthy Eating Plate?
Harvard’s Healthy Eating Plate offers clear meal guidance. Fill half your plate with vegetables and fruits. Choose different types and colors for a wider mix of nutrients.
Use one quarter for whole grains such as brown rice or whole wheat pasta. The last quarter is for healthy proteins like fish, beans, or poultry. Limit processed meats and go easy on red meat.
Use healthy oils in moderation instead of butter or trans fats. Drink water most often and skip sugary drinks. This approach helps you track essential nutrients at every meal.
What Are Dietary Reference Intakes?
Dietary Reference Intakes, or DRIs, are recommendations for how much of each nutrient you need daily. Values change based on age, sex, and life stage.
For example, most adults need about 1,000 milligrams of calcium per day to support bone health. DRIs cover macronutrients like protein and fats, along with vitamins and minerals such as vitamin D and iron.
Governments update DRIs using research to reduce deficiency and disease risk. Many people print a quick DRI chart to guide weekly plans.
How Has the Food Pyramid Evolved?
The Food Pyramid launched in 1992. It placed grains at the base and fatty foods at the top. Over time, experts saw that it did not stress whole grains or healthy fats enough, and portions were confusing.
In 2005, MyPyramid used vertical color bands and promoted activity, but many still found it unclear. In 2011, MyPlate replaced the pyramid with a simple plate graphic split into fruits, vegetables, grains, and protein, with dairy on the side.
MyPlate makes meal proportions clearer and supports balanced nutrition. Many shoppers prefer it because it speeds up planning and grocery lists.
Specialized Nutrition Table Charts for Particular Diets
Specialized charts address unique restrictions and health needs. They guide you toward options that fit your plan.
What Are Low-Sodium Diet Charts?
Low sodium charts organize foods by sodium per serving so you can choose safer options. Categories include grains, meats, dairy, fruits, and vegetables with clear numbers.
The American Heart Association suggests most adults limit sodium to 1,500 to 2,300 milligrams daily. A chart helps you track toward that goal. Choosing fresh foods over processed items often makes a big difference.
What Are High-Protein Eating Plans?
High protein plans raise your protein above typical levels. You focus on lean meats, fish, eggs, dairy, beans, tofu, and nuts. This supports muscle building and weight management.
Many adults aim for 1.2 to 2 grams of protein per kilogram of body weight. This range supplies the amino acids needed for repair and growth. Pair the plan with activity for best results.
Next, see how diabetes charts structure data for better glucose control.
How Do Diabetes Management Charts Work?
Diabetes charts track blood sugar, carbohydrate intake, and medication. They often include testing times, food choices, serving sizes, and activity.
These records reveal patterns across the day. If breakfasts are high in carbs, you may notice higher readings afterward. Use the data to adjust with your healthcare team.
Some printable guides include color coded ranges for target blood sugar or insulin doses for clarity at a glance.
What Are Prenatal and Pregnancy Nutrition Guides?
Prenatal charts support your needs through pregnancy and fetal growth. They highlight calorie needs, hydration, and key vitamins like folic acid, iron, calcium, and vitamin D.
The CDC recommends at least 400 micrograms of folic acid daily before conception and during early pregnancy to lower the risk of neural tube defects.
Guides offer tables of iron rich and protein rich foods and safe serving sizes. Many expecting parents track nutrient goals each trimester using advice from ACOG.
Crafting Your Personal Nutrition Table Chart
With digital tools and apps, you can build a personal chart that reflects your goals and your routine.
Which Digital Tools and Apps Help Create Personal Charts?
- MyFitnessPal offers a large food database, meal logging, and custom macro targets.
- Cronometer tracks vitamins and minerals in detail and supports vegan or keto plans.
- Lose It! scans barcodes, sets calorie goals, and exports nutrition tables.
- Yazio pairs meal planning with visual summaries and smart grocery lists.
- Eat This Much automates meal plans and provides printable summary tables.
- Carb Manager focuses on low carb plans and tracks net carbs, fiber, and macros.
- NutritionData by Self supplies detailed breakdowns of calories, macros, and sodium.
- Fitbit’s app syncs activity with intake and displays balanced meal charts.
- SparkPeople combines community support with nutrient trend charts.
- Microsoft Excel or Google Sheets let you build fully custom printable tables.
These tools organize your nutrient data visually so you can analyze habits quickly.
How Can You Organize Nutrient Data Effectively?
After you pick a tool, keep your chart easy to read. Group foods by major nutrients like carbs, protein, and fats. Create columns for calories, vitamins, minerals, and serving sizes.
Use color codes for fruits, vegetables, grains, dairy, and protein. Arrange entries alphabetically or by meal type. Add filters so you can view high calcium or low sodium foods fast.
Set formulas to total daily values automatically. Graphs and color highlights help you see trends across days or weeks without scanning long lists.
Practical Applications of a Nutrition Table Chart
A chart turns daily choices into simple steps. Use it to build better habits one meal at a time.
How Can You Track Meals and Snacks?
Track meals and snacks with a printable chart or a digital diary. Log foods, portion sizes, calories, and key nutrients each day.
Color code entries for breakfast, lunch, dinner, and snacks. Many apps scan barcodes to speed up logging. Planning your week in advance makes it easier to stay on track.
Consistent tracking helps you spot patterns. You may find frequent high sugar snacks or missed vegetable servings. That awareness drives better choices.
How Does It Help Plan Efficient Grocery Shopping?
Use a chart to make a detailed list before you shop. Match items to your weekly meal plan and target nutrients like fiber or calcium.
If you are limiting sodium, pick low sodium options straight from the chart. Linking sale items to your plan saves money and reduces waste because every item serves a purpose.
How Do You Maintain Dietary Balance Across Meals?
Smart shopping keeps a mix of healthy foods at home. A chart shows what each food brings to your plate, so you can rotate vegetables, lean proteins, and whole grains across the day.
Spread vitamins and minerals throughout meals. For example, choose fruit at breakfast, leafy greens at lunch, and roasted vegetables at dinner. Follow serving sizes so portions add up across the week.
The Impact of Nutrition Table Charts on Public Health
Nutrition table charts support better choices across communities. They encourage people to use clear, evidence based guidance for everyday eating.
How Do They Enhance Consumer Knowledge and Choices?
A chart gives plain information about calories, macronutrients, and micronutrients. You can compare products quickly before you buy.
For example, seeing sodium side by side helps you choose a cereal with less salt. Many Americans eat more than 3,400 milligrams of sodium a day. Using charts can help reduce that number.
Serving sizes and %DV make labels easier to use. You can spot added sugars and unhealthy fats faster, which leads to better decisions for you and your family.
How Are Nutritional Guidelines Used in Community Health Education?
Health educators use MyPlate and DRIs to build lessons for schools, workplaces, and local events. These guides set clear targets for nutrients like fiber, calcium, and iron across age groups.
Workshops often teach label reading with simple examples and real serving sizes. Families see how chart based visuals help them compare snacks quickly using national recommendations.
These efforts give communities practical tools that support shared wellness goals.
Conclusion
A nutrition table chart puts useful health information at your fingertips. You can use it to track meals, plan balanced menus, and compare foods for smarter eating.
Printable versions fit right in your kitchen. Digital charts also keep you motivated as you work toward goals like weight management, heart health, or balanced nutrition. If you have medical conditions or special dietary needs, talk with a healthcare professional for personal advice.
With reliable data and clear guidance, healthy living becomes easier to manage each day.
FAQs
1. What is an essential nutrition table chart and how does it help with healthy eating?
An essential nutrition table chart lists key nutrients, their recommended daily values, and common food sources. It helps people make informed choices by showing which foods provide important vitamins, minerals, protein, carbohydrates, and fats. According to the Centers for Disease Control and Prevention (CDC), using a nutrition guide can improve diet quality and support long-term health.
2. How do I use a printable nutrition table chart in my daily routine?
Place the printable guide where you plan meals or shop for groceries; this makes it easy to check nutrient content before choosing foods. For example, when planning lunches at home last year, I used a printed chart on my fridge to compare fiber levels in grains and vegetables. This helped me add more whole grains to my meals.
3. Why should I trust information from an evidence-based nutrition table?
Evidence-based charts rely on data from reputable organizations like the United States Department of Agriculture (USDA) or peer-reviewed studies published in medical journals such as The American Journal of Clinical Nutrition. These sources ensure accuracy so readers can depend on the information for making dietary decisions.
4. Can children benefit from following a healthy nutrition table guide?
Children gain many benefits by learning about balanced diets through clear guides that show age-appropriate serving sizes and nutrient needs. A recent study found that students who followed visual meal charts increased their fruit intake by 20 percent over six months compared to those without guidance.
Summary: An essential nutrition table chart provides reliable facts about nutrients in everyday foods; it supports better choices for all ages when placed within reach during meal planning or shopping routines.